NetworkIDS: Sniffing Packets and Surfacing Alerts
The problem
Reading about intrusion detection is different from watching packets arrive in real time. I built NetworkIDS to connect textbook ideas - port scans, brute force, floods - to something I could run locally and see on a dashboard.
Theory
An intrusion detection system (IDS) watches network traffic and flags activity that looks wrong. Some IDS tools match known attack signatures. Mine uses simple heuristics instead: count events in a time window (many different ports from one IP, repeated SSH attempts, a burst of ICMP) and treat threshold crossings as alerts.
Packet sniffing means copying frames off the wire as they pass. That requires elevated privileges because the OS normally blocks raw socket access - on Windows via Npcap, on Linux via sudo. The friction is part of the lesson: monitoring tools sit close to the kernel and need deliberate deployment.
While reading up on IDS history, I liked that early open-source projects like Snort helped make packet inspection approachable outside vendor appliances. NetworkIDS is nowhere near that scale - it is a learning stack - but the shape is similar: capture, classify, alert, review.
How it works
Two processes, one pipeline:
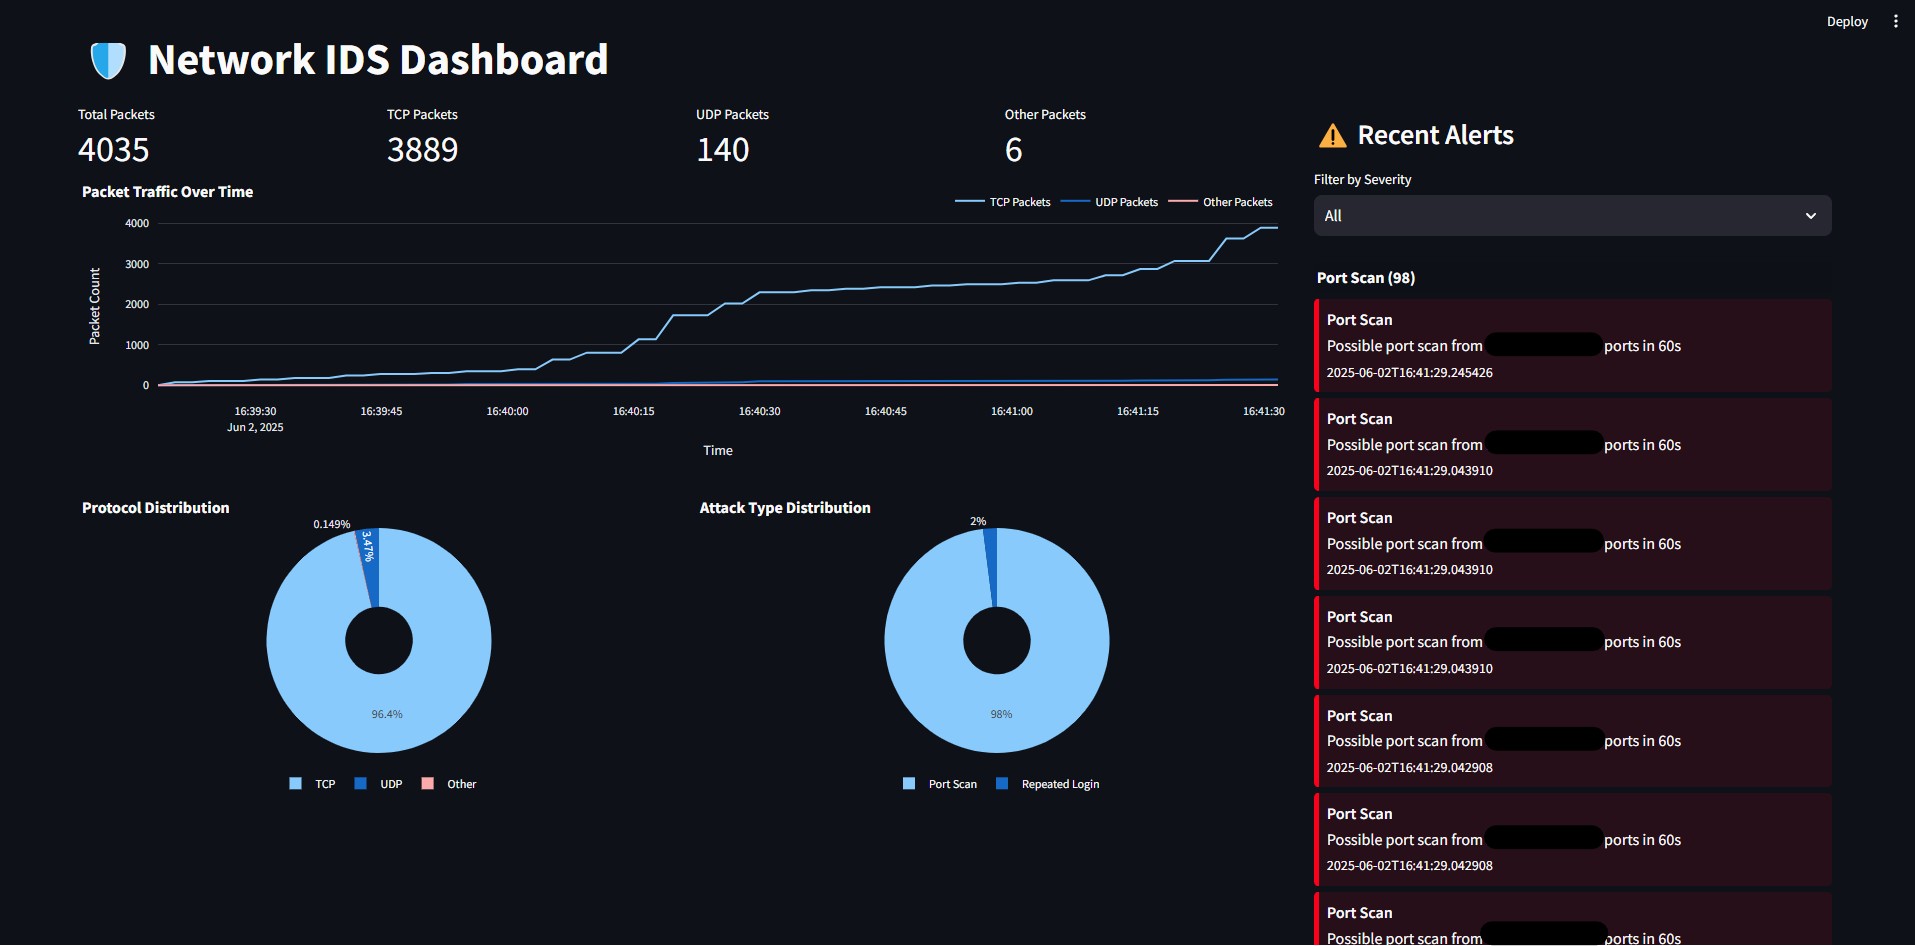
- sniffer.py. Captures TCP, UDP, and ICMP with Scapy, applies detection thresholds, writes stats and alerts to JSON under
data/. - dashboard.py (Streamlit). Reads those files and charts traffic mix, attack categories, and severity-filtered alerts in the browser.
Detections include port scanning, SSH brute-force patterns, ICMP floods, and repeated login attempts. Trusted cloud IP ranges can be whitelisted to cut noise from legitimate services.
Practical constraints
This is a local monitoring experiment, not production NIDS. Packet capture needs admin or root. False positives are expected on busy networks - thresholds in sniffer.py are tunable but not magic.
Disclosure: Parts of this project were developed with AI assistance for README structure, refactoring, and import recommendations - noted in the repo because transparency matters.
What I learned
Alerts only help if someone looks at them. Splitting capture (sniffer) from visualization (dashboard) kept concerns separate, but it also meant I had to run two terminals and remember the sniffer needs privileges the dashboard does not.
Whitelisting cloud ranges taught me how much background noise comes from normal services when you sniff on a machine that also browses the web.
What I'd improve next
Persistent alert storage, correlation rules across sessions, and integration with my Raspberry Pi home server so homelab LAN traffic gets the same treatment as lab traffic.